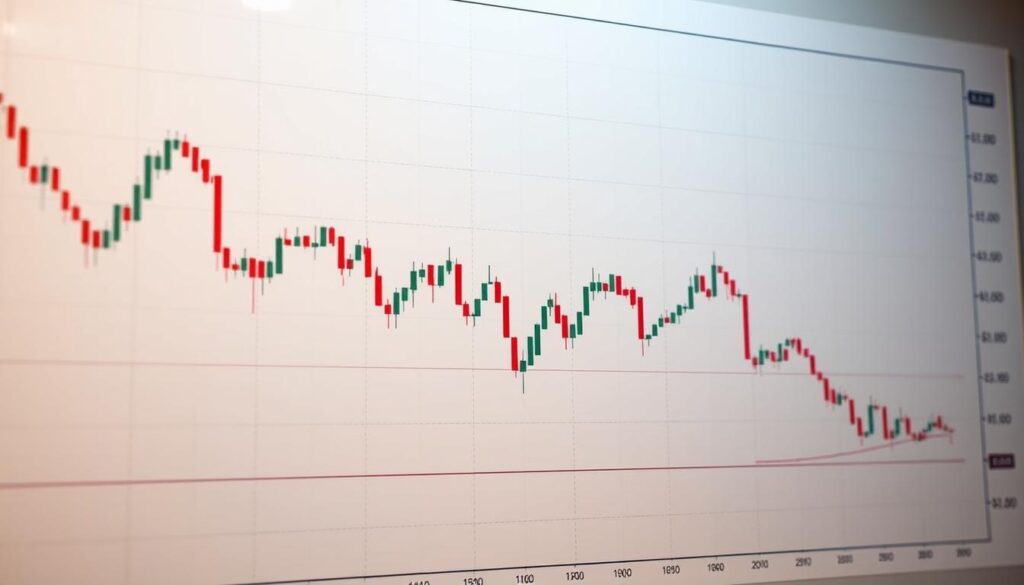
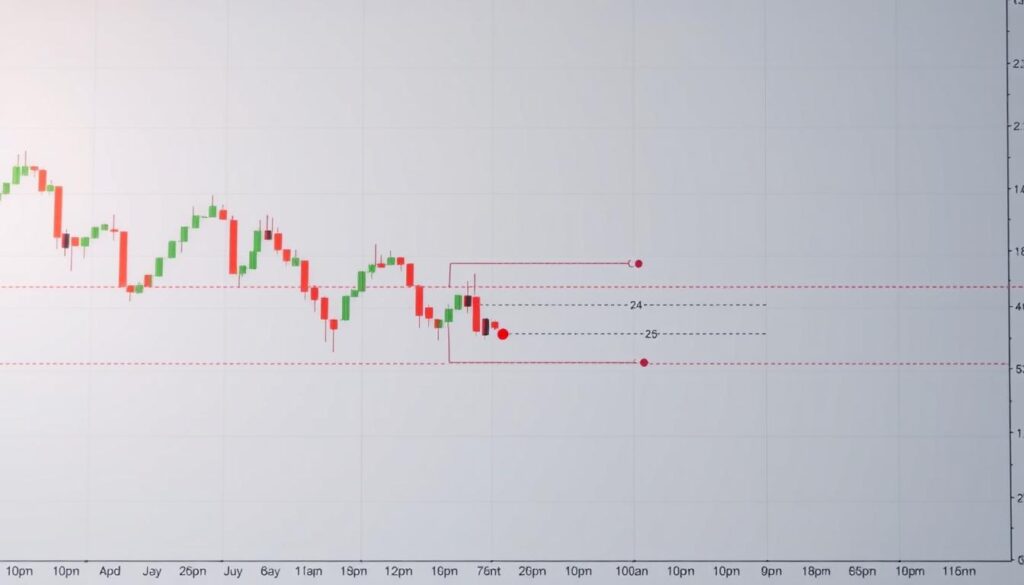
What is an order block in trading? It’s a price zone where large clusters of buy or sell orders accumulate, creating visible support or resistance. Order block definition focuses on these areas where institutions or major traders have traded heavily. These zones act as pressure points, signaling potential turning points in price trends. By analyzing them, traders spot high-probability setups where markets might reverse or breakout.
Key Takeaways
- Order blocks mark critical price levels where major trading activity happened.
- They show where buyers and sellers previously clashed, influencing future moves.
- Used to predict reversals or continuation patterns in charts.
- Key part of price action analysis for timing entries and exits.
- Understanding order block definition helps traders align with institutional trends.
Understanding the Concept of Order Blocks
Mastering the order block explanation starts with grasping how price interacts with hidden liquidity pools. These zones reveal where traders pause before major moves.
What Are Order Blocks?
Order blocks form where buying and selling forces clash. They appear as price ranges where accumulation (buying) or distribution (selling) occurs. These zones act as magnets during retracements, offering clear entry signals. Professional traders analyze these patterns to predict reversals or continuation trends.
Role of Supply and Demand
“Order blocks are where markets breathe,” noted institutional trader Tom Basso. “They show where liquidity clusters create turning points.”
Supply dominates below blocks, creating resistance. Demand accumulates above, forming support. When price breaks these zones, momentum shifts. Traders watch volume spikes and candlestick patterns to confirm shifts in supply/demand balance.
Market Structure and Order Blocks
- Trend phases: Blocks mark pauses within trends, signaling rest periods before resumption
- Ranges: Horizontal blocks show indecision, often preceding breakouts
- Institutional behavior: Large orders stack at these zones to control price movement
Understanding this structure helps traders align with market phases instead of fighting trends. Most charting platforms now offer tools like Volume Profile to visualize these zones clearly.
Importance of Order Blocks in Trading Strategy
Mastering the order block strategy transforms how traders approach the markets. These zones act as roadmaps, guiding decisions on when to act and when to wait. By pinpointing critical price levels, traders can align their moves with market structure, not guesswork.
Identifying Entry and Exit Points
Order blocks highlight where buyers and sellers clash, creating clear entry signals. Here’s how they work:
- Entries: Breakouts from strong blocks signal trend starts—ideal for opening positions.
- Exits: Rejection zones mark profit targets, showing when to secure gains before reversals.
Risk Management with Order Blocks
Risk isn’t just managed—it’s calculated. Use blocks to:
- Set stop-losses just beyond block boundaries to avoid false signals.
- Adjust position size based on block size—larger blocks demand bigger trades.
“Order blocks keep me focused. They’re the difference between reacting and planning.” — Professional trader, 2023
Pairing order blocks with a solid order block strategy builds discipline. They’re not magic tricks but tools to turn market history into actionable steps. Always combine them with other indicators for balanced decisions.
How to Identify Order Blocks in Price Charts
Mastering order block analysis starts with visual patterns in price history. Look for zones where price reverses after testing the same area repeatedly. These zones mark accumulation points where buyers or sellers hesitated. Here’s how to spot them clearly.

Analyzing Historical Price Action
Search past charts for rejection zones where price hit a level three or more times. For example, a bullish order block forms when price climbs to a resistance, pulls back, then retests it before breaking higher. Watch for candle patterns like doji or spinning tops signaling indecision.
“The market whispers its plans through price history,”
say traders who rely on this method. Volume spikes or gaps near these zones confirm block strength.
Common Tools for Finding Order Blocks
- Volume Profile: Shows clusters of past trades
- Fibonacci retracements: Highlight key reversal points
- Price bars: Look for narrowing ranges before breakout
Tools like TradingView or MetaTrader let you draw horizontal lines on historical peaks. Combine with moving averages to see trends. Remember: Practice on free platforms first to build confidence. Order block analysis improves with repeated study of past charts.
Distinguishing Between Order Blocks and Support/Resistance Levels
Traders often mix up order blocks with support/resistance levels. Let’s break down their differences clearly. The order block explanation shows how these tools differ in purpose and use.
Key Differences Explained
Order blocks focus on price ranges where buyers and sellers clashed, marked by volume spikes. Support/resistance are horizontal lines where price previously reversed. Here’s how they differ:
- Formation: Order blocks form over days/weeks; S/R lines form instantly at past highs/lows.
- Volume Role: Blocks require high volume to confirm significance. S/R ignores volume unless paired with other tools.
- Behavior After Break: Breaking an order block often signals a strong trend. S/R breaks can lead to quick reversals or false breaks.
Situational Uses of Each
Use order blocks when analyzing trending markets. For example, during news events, their volume-based structure highlights real turning points. Support/resistance work better in sideways markets to spot range boundaries.
“Order blocks are like pressure points in a fight—they show where battles were won or lost. S/R is just a line in the sand.” — Larry Williams, Technical Analyst
Mastering both tools boosts your edge. Start by mapping both on your charts. For choppy markets, rely on S/R. In trending phases, let order blocks guide entries. Practice spotting their unique traits, and you’ll avoid costly mix-ups.
Types of Order Blocks: Bullish and Bearish
Traders classify order blocks into two key types based on market sentiment: bullish and bearish. These formations refine the order block definition by showing whether buyers or sellers are gaining control. Each type’s traits and context matter as much as their shape.
| Type | Price Action | Volume | Signal | Market Use |
|---|---|---|---|---|
| Bullish | Higher lows, price holds support | Rising during consolidation | Buy-side dominance | Uptrends, ranging markets |
| Bearish | Lower highs, price rejects resistance | Falls as sellers take control | Sell-off potential | Downtrends, overbought zones |
“Bullish blocks thrive in strong trends, while bearish ones clarify reversals in overextended moves,” says market analyst Jane Smith, highlighting their context-dependent reliability.
Characteristics of Bullish Order Blocks
Bullish formations signal buyer readiness to push prices higher. Look for:
- Price bouncing off support levels
- Higher closing prices within the block
- Volume peaks during test attempts
Characteristics of Bearish Order Blocks
Bearish blocks highlight seller strength. Key signs include:
- Price fails to break resistance
- Lower closes within the block
- Volume drops during key tests
Traders using these traits in forex and equity markets note bearish blocks often precede corrections in overbought ranges. Mastering these distinctions keeps strategies aligned with real market pressures.
Practical Steps to Trade Using Order Blocks
Mastering how to trade order blocks starts with a clear setup and disciplined execution. Follow these steps to turn analysis into profitable trades without guesswork.

Setting Up Your Trading Platform
Optimize your tools for precision:
- Choose platforms like TradingView or MetaTrader for customizable charts
- Use 1-hour or 4-hour charts to spot blocks clearly
- Enable line charts to simplify trendline drawing
- Add volume overlays to confirm block significance
Entry Strategies Based on Order Blocks
Turn setups into actions with these rules:
- Wait for retests: Enter only when price touches the block’s high/low
- Confirm with signals: Look for bullish engulfing candles or rising volume
- Set stops: Place stops just beyond the block’s edge to manage risk
| Step | Setup Detail | Entry Signal |
|---|---|---|
| 1 | 1-hour chart with line study | Bullish pin bar at block top |
| 2 | Volume indicator enabled | Increasing volume on breakout |
| 3 | Alerts for key levels | Price closes above/below block |
Consistency beats perfection. Start small, track results, and tweak setups gradually. Every trade is a learning step toward mastering how to trade order blocks effectively.
Real-World Examples of Order Blocks in Trading
Seeing order blocks in action helps traders grasp their real impact. Let’s look at two markets where these patterns drive price moves.
Case Study: Forex Market
In the order block forex example, EUR/USD formed a horizontal zone between 1.1000 and 1.1050 over 10 days. Traders noted:
- Price repeatedly tested the zone’s top and bottom.
- Volume spiked at key levels, confirming institutional interest.
- A breakout above 1.1050 triggered a 300-pip rally.
Thisorder block forexpattern is common in majors like USD/JPY too, where big banks and funds shape clear formations.
Case Study: Stock Market
Take Apple (AAPL) stock hovering between $150 and $155. The order block here showed:
- A 2-week consolidation phase
- Higher volume at resistance (the $155 level)
- A breakout leading to a 12% gain
Stocks reveal smaller-scale order blocks but follow the same principles as forex.
| Market | Asset | Breakout Direction | Result |
|---|---|---|---|
| Forex | EUR/USD | Upward | 300-pip gain |
| Stock | AAPL | Upward | 12% price jump |
Both examples highlight how order blocks mark turning points. Practicing with historical charts builds pattern recognition—key before live trading.
Common Mistakes to Avoid When Trading Order Blocks
Mastering order block analysis requires vigilance. Traders often overlook critical details when using platforms like TradingView, leading to costly errors. Here’s how to sidestep these traps.
Misinterpreting Order Blocks
Key errors include:
- Confusing random price swings with true order blocks
- Ignoring broader trends when analyzing blocks
- Assuming small clusters qualify as significant blocks
| Mistake | Fix |
|---|---|
| Overlooking volume data | Use TradingView’s volume profiles to confirm block validity |
| Forcing patterns | Verify blocks align with price action and trend direction |
Over-Reliance on Order Blocks
Balance is key. Here’s how to avoid over-dependence:
- Combine order blocks with indicators like RSI or moving averages
- Verify block validity across multiple timeframes
“Order blocks are clues, not guarantees,” says expert analyst Lisa Tran. “Always cross-reference with fundamentals and volatility.”
Platforms like TradingView offer tools to spot order blocks, but never rely on them alone. Stay alert to shifts in liquidity and news events that override technical patterns.
Resources for Further Learning About Order Blocks
Ready to take your next steps in mastering order block trading? Explore these resources to refine your skills and stay updated. Understanding tools like the Market-On-Close execution can also enhance how you time entries alongside order block analysis.
Recommended Books and Articles
Begin with foundational texts like “Price Action Trading” by Jason Roney, which covers price patterns tied to order blocks. “Mastering the Trade” by Kirk Du Plessis dives into practical applications of supply and demand zones. Online, articles from traders like Tom Basso or Perry Cohen often highlight real-world order block setups. These resources clarify how to spot accumulation/distribution zones manually before relying on automated tools.
Online Courses and Webinars
Platforms like TradingView host courses explaining how to build custom order block indicator tools. Udemy’s “Price Action Mastery” course includes modules on identifying block reversals. Join live webinars by traders like Steve Burns to see manual vs. automated analysis in real time. Remember, while order block indicators save time, mastering their limitations through practice ensures smarter trading decisions.

